Image Details
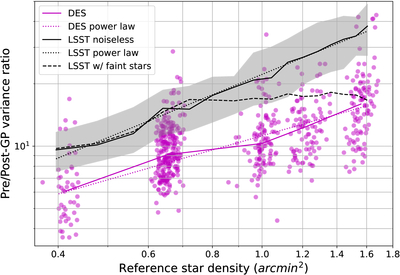
Caption: Figure 1.
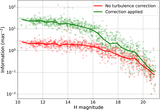
The turbulence variance reduction factor (﹩{C}_{0}^{\rm{pre}\,}/{C}_{0}^{\,\rm{post}}﹩) is plotted as a function of the reference star density on LSST simulations (black) and real DES exposures (purple). The solid black shows the median variance reduction attained for LSST simulations with a fixed 1 mas measurement uncertainty per star. The gray zone represents 1σ exposure-to-exposure rms variation. The simulations shown with black dashed line also include expected magnitude-dependent LSST measurement noise per star, with higher density values representing the use of fainter-than-Gaia reference stars. The black dotted line is a power-law fit to the variance reduction in the noiseless scenario. The magenta dots are individual DES exposures; the solid line, their median value, and the dotted line, a power-law fit.
Other Images in This Article
Copyright and Terms & Conditions
© 2025. The Author(s). Published by the American Astronomical Society.