Image Details
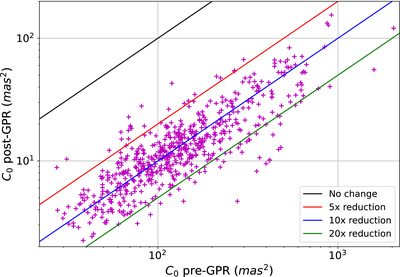
Caption: Figure 3.
Improvement in the variance of the turbulence field on 604 DES exposures. The x-axis shows the pre-GPR variance computed from (12); and the y-axis, the variance of the GPR-model-subtracted residuals. Each point corresponds to a single DES exposure. The diagonal lines depict the ratios: 1x (No change), 5x reduction, 10x reduction and 20x reduction, which correspond to 1x, 2.2x, 3.2x and 4.5x reduction of the per-axis rms.
Other Images in This Article
Copyright and Terms & Conditions
© 2025. The Author(s). Published by the American Astronomical Society.
Copyright ©
2026 Astronomy Image Explorer. All Rights Reserved.