Image Details
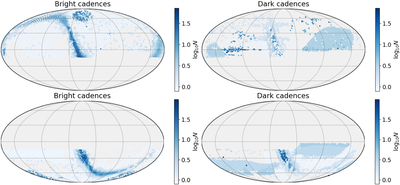
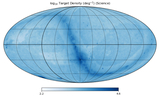
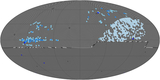
Caption: Figure 11.
Distribution of number of planned observations N on the sky in dark and bright time at each observatory (top is APO, bottom is LCO). The sky projection is the same as Figure 6. These are the allocations from the iota-1 run of robostrategy.
Other Images in This Article
Show More
Copyright and Terms & Conditions
© 2025. The Author(s). Published by the American Astronomical Society.
Copyright ©
2025 Astronomy Image Explorer. All Rights Reserved.