Image Details
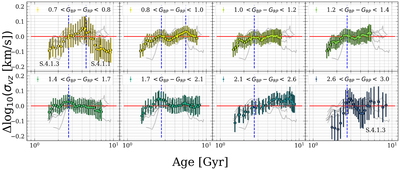
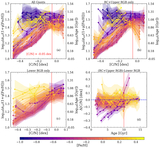
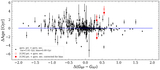
Caption: Figure 6.
The difference in σvz in various color bins between the σvz–age relation determined from our gyrochronology ages in this work and that from APOKASC–3. This is similar to first getting ages with the steps described in Figure 3, then calculating the age–velocity dispersion relation with the ages inferred, then subtracting the AVR from APOKASC–3 shown in red in plot (d) of Figure 3, which is not a linear relation as assumed. This shows how well our method can be applied to infer gyrochronology ages. The gray lines in the background shows the difference for all color bins for better comparison. The vertical blue dashed lines at 2.7 Gyr show the location where an excess in σvz can be seen using our gyrochronology ages compared to using the ages from APOKASC–3. This excess becomes more significant moving toward lower-mass stars. The location of this bump is close to the intermediate period gap. The second vertical blue dashed lines at older ages for GBP − GRP < 1 shows the location near Ro = Rocrit in plot (b) of Figure 5. The error bars combine the uncertainties in the σvz–gyrochronology age relation and the σvz–APOKASC–3 age relation. The combined uncertainty is calculated by addition in quadrature. The sections corresponding to the the features are shown on the figures.
Other Images in This Article
Show More
Copyright and Terms & Conditions
© 2025. The Author(s). Published by the American Astronomical Society.