Image Details
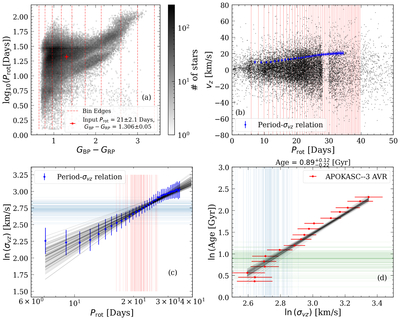
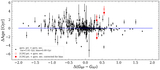
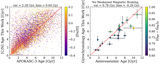
Caption: Figure 3.
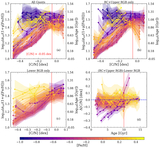
(a): (GBP − GRP)–Prot 2D density plot of the full sample of rotation periods obtained from Kepler, ZTF, and TESS. The red dashed lines show the bin edges used to obtain the Prot–σvz relations. The red point shows the example star to infer age. (b): The Prot–vz scatter plot for the color bin the example star is in. The red lines show the bin edges used to obtain the Prot–σvz relation for this color bin. The gap between 28 and 30 days is the result of excluding ZTF stars that are affected by the orbit of the Moon. The blue points with error bars in both plots (b) and (c) show the resulting Prot–σvz relation for this color bin. σvz is calculated for each narrow Prot bin (as indicated by the red vertical lines) by taking the 1.5× the median absolute deviation of the vertical velocities (as shown as the underlying black points) in each bin. (c): The black lines show the Deeming regression results. The 100 realizations of the period perturbed within its uncertainty for the example star are shown as red vertical lines, and the corresponding σvz taking into account the uncertainty of the fit is shown as the blue horizontal lines. This is the expected σvz for this star. (d): The red points show the AVR from APOKASC–3, and the black lines show the 100 realization of the relation, assuming solar metallicity. The blue vertical lines show the 100 realizations obtained from plot (c), and the green horizontal lines show the final inferred age posterior using the method described in this work.
Other Images in This Article
Show More
Copyright and Terms & Conditions
© 2025. The Author(s). Published by the American Astronomical Society.