Image Details
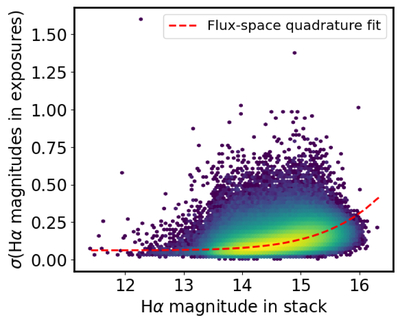
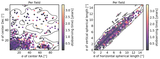
Caption: Figure 25.
For sources in the DR1 stack catalog, their stack Hα magnitude compared to the standard deviation (σ) of their magnitudes across the individual exposures. The bins are colored by source density, revealing a quadrature relationship between stack Hα and σ(Hα). See Section 6.2 for details.
Other Images in This Article
Show More
Copyright and Terms & Conditions
© 2025. The Author(s). Published by the American Astronomical Society.
Copyright ©
2025 Astronomy Image Explorer. All Rights Reserved.