Image Details
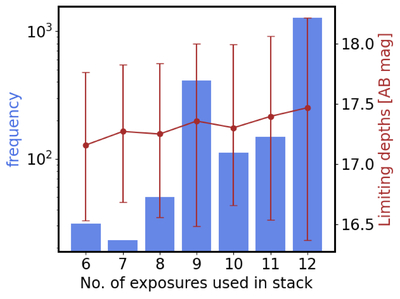
Caption: Figure 9.
The frequency of fields (left axis, blue bars) and the range of their limiting depths (95th percentile of calibrated Hα magnitudes; right axis, red points) as functions of the number of exposures used in the averaged stack. For their respective bins, the red dots represent the medians, and the 10th and 90th percentiles by the bars.
Other Images in This Article
Show More
Copyright and Terms & Conditions
© 2025. The Author(s). Published by the American Astronomical Society.
Copyright ©
2025 Astronomy Image Explorer. All Rights Reserved.