Image Details
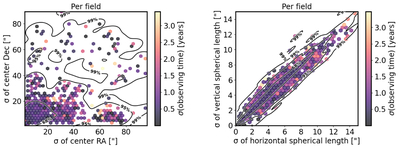
Caption: Figure 5.
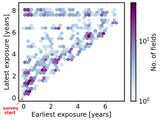
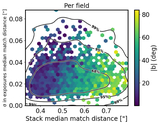
For each DR1 field, we plot the deviation in each exposure’s center coordinate (left) and the deviations in its horizontal and vertical spherical lengths for the same set of consecutive pixels (right). For both plots, we color the bins by the standard deviation in exposure observing times (also see Figure 4). Many outlier fields have either a broad or narrow range in exposure observation dates.
Other Images in This Article
Show More
Copyright and Terms & Conditions
© 2025. The Author(s). Published by the American Astronomical Society.
Copyright ©
2025 Astronomy Image Explorer. All Rights Reserved.