Image Details
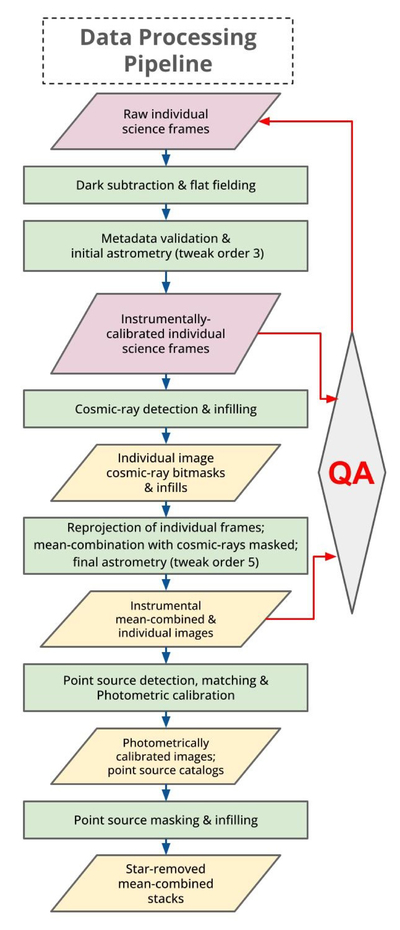
Caption: Figure 7.
Overview of the data acquisition and processing pipeline. For each step, details are described and discussed in Sections 3–5. The green boxes indicate processes, while the parallelograms indicate data products (purple for intermediate and unreleased products; yellow for released products) A list of DR1 data products can be found in Table 2.
Other Images in This Article
Show More
Copyright and Terms & Conditions
© 2025. The Author(s). Published by the American Astronomical Society.
Copyright ©
2025 Astronomy Image Explorer. All Rights Reserved.