Image Details
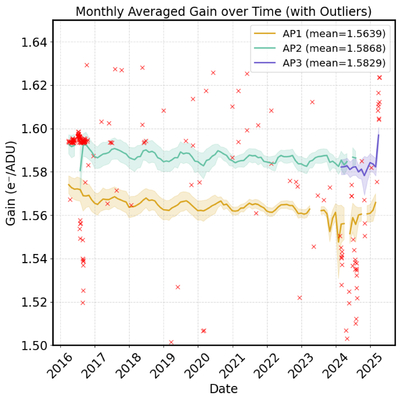
Caption: Figure 21.
Gain factor over time for each of the three telescopes. The outliers are marked in red crosses and are discarded from data processing. Because flat fields are taken very frequently, we show the binned monthly averages in this plot.
Other Images in This Article
Show More
Copyright and Terms & Conditions
© 2025. The Author(s). Published by the American Astronomical Society.
Copyright ©
2025 Astronomy Image Explorer. All Rights Reserved.