Image Details
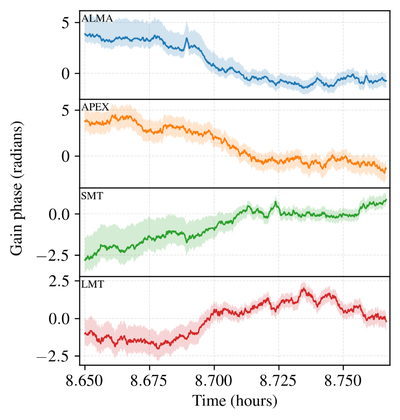
Caption: Figure 5.
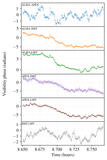
Recovered station gain phases vs. time for each of the stations participating in the scan whose visibility phases are shown in Figure 4. The solid curve in each panel shows the median posterior value, and the shaded region indicates the 90% confidence interval.
Other Images in This Article
Copyright and Terms & Conditions
© 2025. The Author(s). Published by the American Astronomical Society.
Copyright ©
2025 Astronomy Image Explorer. All Rights Reserved.