Image Details
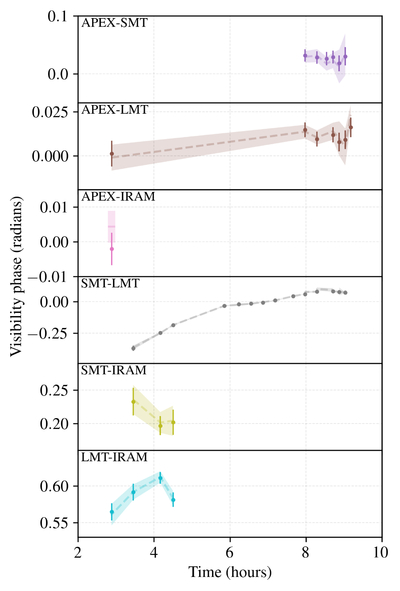
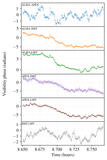
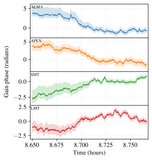
Caption: Figure 6.
Calibrated and scan-averaged visibility phase vs. time on each of the non-ALMA baselines in the EHT 3C 279 dataset. In each panel, the baseline is specified in the upper-left corner. The data calibrated by the EHT Collaboration are shown as dashed lines with shading indicating 1σ confidence regions, while the results of the calibration carried out in this paper are shown as circular markers with error bars (again indicating 1σ confidence regions).
Other Images in This Article
Copyright and Terms & Conditions
© 2025. The Author(s). Published by the American Astronomical Society.
Copyright ©
2025 Astronomy Image Explorer. All Rights Reserved.