Image Details
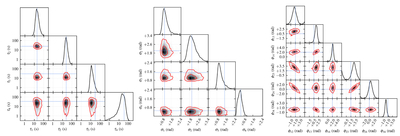
Caption: Figure 2.
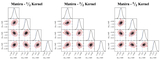
Posterior distributions for the model parameters determined from fitting synthetic data. Left: pairwise distributions for the coherence timescale parameters τi. Center: pairwise distributions for the phase fluctuation magnitude parameters σi. Right: posterior distributions for the visibility phase parameters ϕij. For all two-dimensional distributions, the red contours enclose 50% and 90% of the posterior probability. Blue lines represent the input values used when generating the synthetic data.
Other Images in This Article
Copyright and Terms & Conditions
© 2025. The Author(s). Published by the American Astronomical Society.
Copyright ©
2025 Astronomy Image Explorer. All Rights Reserved.