Image Details
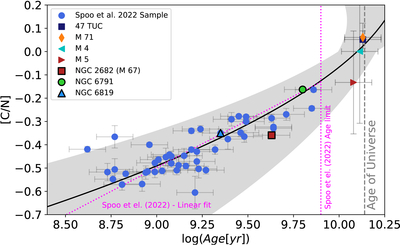
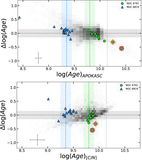
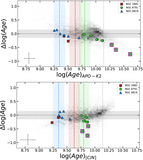
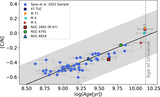
Caption: Figure 6.
The [C/N] versus ﹩\mathrm{log}\,(\mathrm{Age}[\mathrm{yr}])﹩ distribution for the final sample, composed of the T. Spoo et al. (2022) open cluster sample and globular clusters 47 TUC, M 71, M 4, and M 5. Clusters represented by blue circles are from the final calibration sample of T. Spoo et al. (2022). Globular clusters 47 TUC, M 71, M 4, and M 5 are represented with an indigo square, an orange thin diamond, a cyan left triangle, and a red right triangle, respectively. Our new fit is shown as a solid black line, and the maximum possible calculated age envelope is shown with the gray region. The accepted age of the Universe (13.8 ± 0.05 Gyr; Planck Collaboration et al. 2020; DESI Collaboration et al. 2024a; DESI Collaboration et al. 2024b) is shown as a vertical gray dashed line. The open clusters used in our asteroseismic age comparison are NGC 2682 (M 67), NGC 6791, and NGC 6819 and are shown in a black-outlined red square, green circle, and blue triangle, respectively. Note: uncertainties on the ages for the globular clusters are assumed by this work to be ±0.1, thus conservative, and are likely smaller.
Other Images in This Article
Copyright and Terms & Conditions
© 2025. The Author(s). Published by the American Astronomical Society.