Image Details
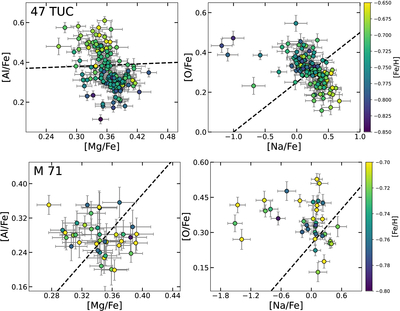
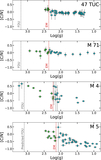
Caption: Figure 2.
[Al/Fe]–[Mg/Fe] and [O/Fe]–[Na/Fe] (anti)correlation plots for globular clusters 47 TUC (top set) and M 71 (bottom set) colored by [Fe/H]. Black dashed lines represent functions to isolate the two populations of stars within the RGB sample.
Other Images in This Article
Copyright and Terms & Conditions
© 2025. The Author(s). Published by the American Astronomical Society.
Copyright ©
2025 Astronomy Image Explorer. All Rights Reserved.