Image Details
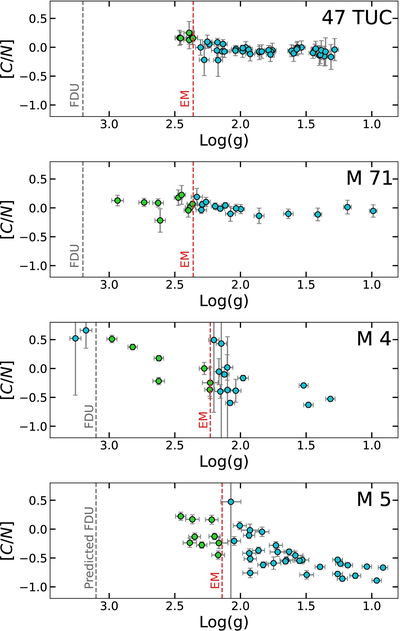
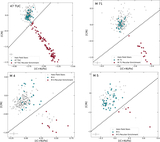
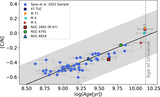
Caption: Figure 5.
Log(g) versus [C/N] plot of first population of stars without peculiar enrichment. These are the same stars from Figure 4 shown in cyan. Stars used in our calibration are shown in green. The gray vertical dashed line and vertical red dashed line represent the FDU log(g) cut and extramixing (EM), respectively, from Table 2 of M. Shetrone et al. (2019).
Other Images in This Article
Copyright and Terms & Conditions
© 2025. The Author(s). Published by the American Astronomical Society.
Copyright ©
2025 Astronomy Image Explorer. All Rights Reserved.