Image Details
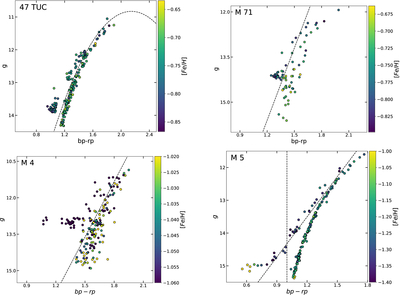
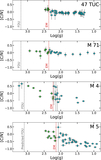
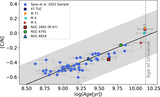
Caption: Figure 1.
Gaia color–magnitude diagram for globular clusters 47 TUC, M 71, M 4, and M 5 colored by [Fe/H]. Black dashed lines represent the polynomial functions used to separate RGB from red clump and AGB members of each cluster. Note the magnitude errors are smaller than the markers.
Other Images in This Article
Copyright and Terms & Conditions
© 2025. The Author(s). Published by the American Astronomical Society.
Copyright ©
2025 Astronomy Image Explorer. All Rights Reserved.