Image Details
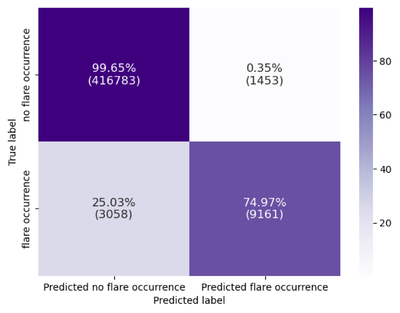
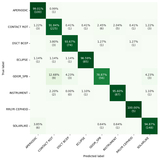
Caption: Figure 9.
Confusion matrix illustrating the performance of the flare identification model. The matrix compares the predicted labels (x-axis) with the true labels (y-axis) for two classes: “no flare occurrence” and “flare occurrence.”
Other Images in This Article

Show More
Copyright and Terms & Conditions
© 2025. The Author(s). Published by the American Astronomical Society.
Copyright ©
2026 Astronomy Image Explorer. All Rights Reserved.