Image Details
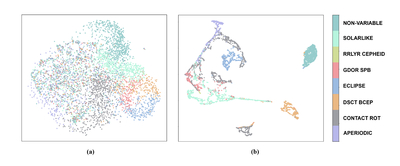
Caption: Figure 10.
UMAP visualization of the comparison of original light curves and output embedding for the task of stellar variability classification. Figure (a) on the left illustrates the original light-curve data, while Figure (b) on the right illustrates the output embedding generated by FALCO for classification purposes.
Other Images in This Article
Show More
Copyright and Terms & Conditions
© 2025. The Author(s). Published by the American Astronomical Society.
Copyright ©
2026 Astronomy Image Explorer. All Rights Reserved.