Image Details
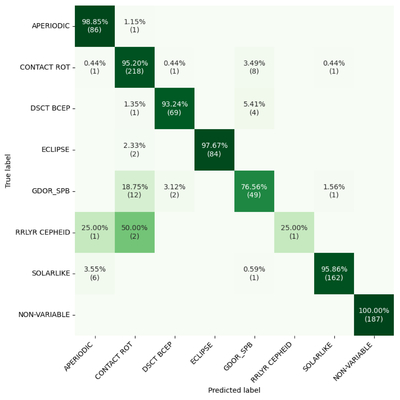
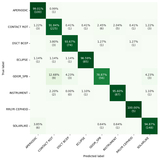
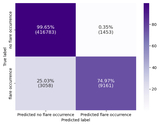
Caption: Figure 6.
Confusion matrix for stellar variability classification in the context of XLarge-200, where the labeling scheme differs by including the NONVARIABLE class and excluding the INSTRUMENT class. Each cell similarly presents the percentage and absolute number of instances, with darker diagonal cells indicating higher classification accuracy. Compared to Figure 7, the introduction of the NONVARIABLE category shifts some borderline cases and slightly alters the distribution of misclassifications among closely related classes.
Other Images in This Article

Show More
Copyright and Terms & Conditions
© 2025. The Author(s). Published by the American Astronomical Society.
Copyright ©
2026 Astronomy Image Explorer. All Rights Reserved.