Image Details
Caption: Figure 4.
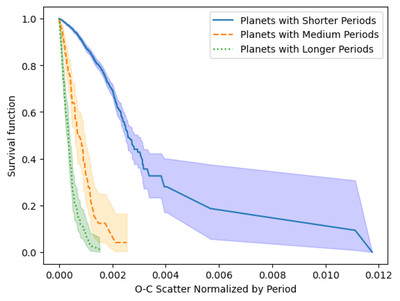
Kaplan–Meier plot depicting the data from Table 3 of H16 reconstructed into “weeks.” Here, we treat each set of seven consecutive transits as its own KOI to remove the bias of short-period planets being observed more frequently. The blue solid function corresponds to short-period “weeks” (P ≤ 50 days), the orange dashed function corresponds to medium-period “weeks” (50 < P < 65 days), and the green dotted function corresponds to long-period “weeks” (P ≥ 65 days). The survival function dictates what percentage of KOIs in the group remain undetected at that level of normalized O − C scatter. The long tail of the short-period planet distribution highlights that 40% of such planets are still undetected with a normalized O − C scatter of approximately 0.0031, whereas no planets with medium or long orbital periods require such extreme scatter to be detected. By exploring each KOI as a set of seven transits, we find that KOIs with inherently short orbital periods require more O − C scatter, and therefore greater TTVs, than long-period planets to be detected.
Other Images in This Article
Copyright and Terms & Conditions
© 2025. The Author(s). Published by the American Astronomical Society.