Image Details
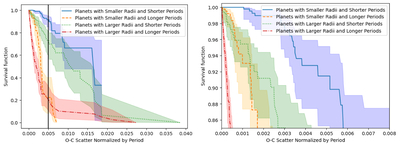
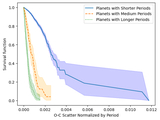
Caption: Figure 2.
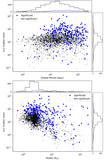
Left: Kaplan–Meier graph depicting the proportion of KOIs for which we did not detect significant levels of TTV (y-axis) given the O − C scatter normalized by orbital period (x-axis) for the 2339 KOIs included in Table 4 of H16. We group KOIs based on median planetary radius (2.482 Earth radii) and median orbital period (17.79 days), creating four groups: “small radii/short period” (690 KOIs, blue, solid line), “small radii/long period” (480 KOIs, orange, dashed line), “large radii/short period” (480 KOIs, green, dotted line), and “large radii/long period” (689 KOIs, red, dotted–dashed line). The shaded regions represent the 95% confidence intervals for each survival function. There is a vertical black solid line denoting a normalized scatter of 0.005. Right: close-up of the survival function depicted on the left between 0.85 and 1. The survival function dictates what percentage of KOIs in the group remain undetected and have at least that amount of normalized O − C scatter. For example, ∼90% of large planets with short periods (green, dotted) are not detected at a normalized O − C scatter of 0.0025, and ∼91% of small planets with short periods (blue, solid) are not detected with a normalized O − C scatter of 0.005. Regardless of planet size, KOIs with short orbital periods require higher levels of TTVs to be detected.
Other Images in This Article
Copyright and Terms & Conditions
© 2025. The Author(s). Published by the American Astronomical Society.