Image Details

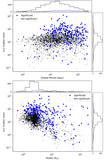
Caption: Figure 3.
Scatter plot visualizing the distribution of normalized O − C scatter (log-scaled, y-axis) for significant KOIs with respect to their orbital period in days (x-axis). We group KOIs based on median planetary radius (2.482 Earth radii) with small planets represented by red circles and large planets represented by blue circles. Additionally, we include the six significant KOIs that we identify in Section 2.4 as black diamonds. We find that short-period planets (those with P ≲ 18 days) exhibit a larger range of normalized O − C scatter than their long-period counterparts. However, the lower envelope of the distribution (≈3 × 10⁻⁵) is consistent across all periods. This reflects an observational bias, with short-period planets requiring stronger TTV signals to be detected, rather than an intrinsic difference in TTV amplitude across orbital periods. Although the wider range of O − C scatter at short orbital periods is primarily driven by large planets, which span several orders of magnitude, small planets also exhibit substantial normalized TTV amplitudes, despite having a narrower range.
Other Images in This Article
Copyright and Terms & Conditions
© 2025. The Author(s). Published by the American Astronomical Society.