Image Details
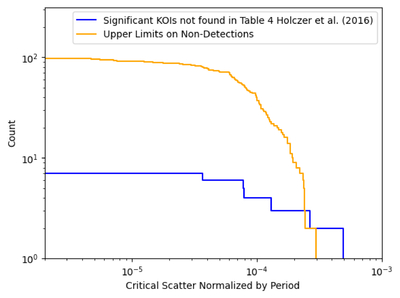
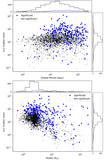
Caption: Figure 1.
Cumulative distribution functions of the critical O − C scatter (from Equation (2)) for the 98 long-period KOIs excluded by H16 (orange) and of the O − C scatter for six statistically significant planet candidates (blue). These six candidates (KOIs: 108.02, 351.02, 868.01, 1209.01, 1477.01, and 1783.02) were not considered detections by H16 because they had fewer than seven transits. These KOIs meet the criteria for significance established by D. V. Martin et al. (2019) (i.e., log(p) < −8.8). Each step “up” in the blue curve, moving from right to left, indicates a significant signal within the step range, while the orange curve represents the cumulative count distribution of the 98 upper limits for the scatter with insignificant levels of TTV. We normalize both the critical and the measured O − C scatter by taking the rms of the TTV divided by the best-fitting orbital period. Note that both axes are logarithmically scaled.
Other Images in This Article
Copyright and Terms & Conditions
© 2025. The Author(s). Published by the American Astronomical Society.