Image Details
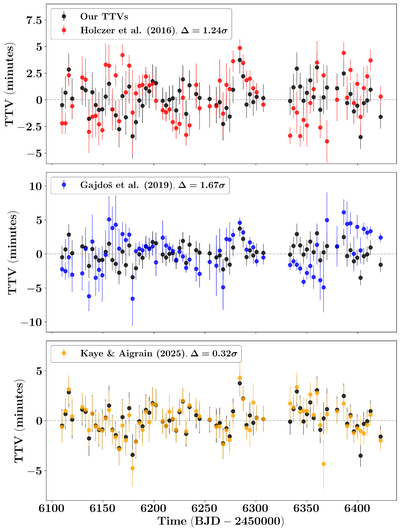
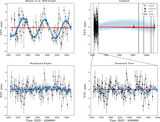
Caption: Figure 5.
Comparison to published TTVs. Our TTVs are plotted with black circles. TTVs reported by T. Holczer et al. (2016), P. Gajdoš et al. (2019), and L. Kaye & S. Aigrain (2025) are plotted in red, blue, and yellow circles, respectively. The Δ values in the legend represent the average difference between each study’s TTVs and ours, normalized by the measurement uncertainties of our TTVs.
Other Images in This Article
Copyright and Terms & Conditions
© 2025. The Author(s). Published by the American Astronomical Society.
Copyright ©
2025 Astronomy Image Explorer. All Rights Reserved.