Image Details
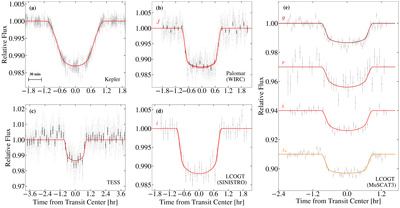
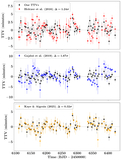
Caption: Figure 3.
Transit light curves for Kepler-1624b from multiple instruments. (a) Kepler, (b) Palomar/WIRC, (c) TESS, (d) LCOGT/SINISTRO i band, and (e) LCOGT/MuSCAT3 multiband. For Kepler, the light curves of individual transits are phased up using the individual best-fit transit times. For TESS, we phase individual transits using transit times from the best-fit one-planet model. For (a), the gray points show unbinned phased data, where each point corresponds to a 30 minute integration. For (b), unbinned photometry is shown as gray circles, and 10 minute binned photometry is shown as black circles. For (c), we use 10 minute bins for the black points and 2 minute bins for the gray points. For (d), we show the unbinned data as gray points. For (a)–(d), the best-fit transit light curves are overplotted in red, with the 1σ confidence range overplotted as light red shading. For (e), transits in g, r, i, and zs bands are plotted with different colors with an arbitrary vertical offset, and the gray points represent the observed data, while the colored lines show the best-fit transit model for each band with a 1σ confidence range overplotted with the corresponding color of shading. For some of the panels, the 1σ confidence shading is not visually noticeable due to very tight confidence ranges.
Other Images in This Article
Copyright and Terms & Conditions
© 2025. The Author(s). Published by the American Astronomical Society.