Image Details
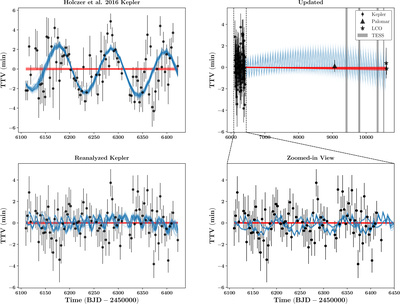
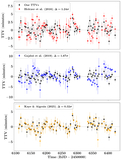
Caption: Figure 4.
Transit timing variations with dynamical models. The 100 random posterior draws from the two-planet model (blue) and one-planet model (red) are plotted. The top-left panel displays the original Kepler TTVs from T. Holczer et al. (2016), showing a clear sinusoidal pattern. The bottom-left panel presents our reanalysis of the Kepler data. The top-right panel displays all observed transit timings from Kepler, Palomar, and LCOGT. The time intervals where TESS transits occur are shaded in gray. The Kepler points are plotted with black circles. The Palomar point is plotted with a triangle, and the two LCOGT points are plotted with stars. The bottom-right panel presents a zoomed-in view of the Kepler data from the top-right panel.
Other Images in This Article
Copyright and Terms & Conditions
© 2025. The Author(s). Published by the American Astronomical Society.