Image Details
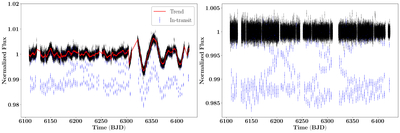
Caption: Figure 2.
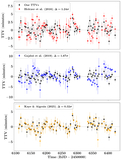
Kepler light curve before detrending (left) and after detrending (right). The red line shows the Gaussian kernel convolution trend described in Section 2.2. Blue points indicate masked data (±0.8 transit durations around each transit midtime).
Other Images in This Article
Copyright and Terms & Conditions
© 2025. The Author(s). Published by the American Astronomical Society.
Copyright ©
2025 Astronomy Image Explorer. All Rights Reserved.