Image Details
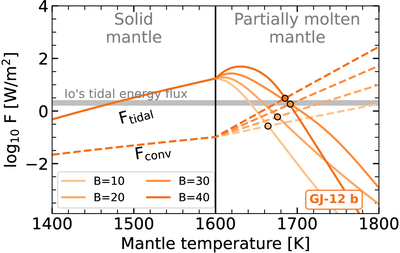
Caption: Figure 12.
Illustration of the internal energy balance calculation with melt for GJ-12 b. We illustrate the calculations of both Fconv (dashed) and Ftidal (solid lines) as a function of mantle temperature, with equilibria highlighted for each B value with black circles. The constraints on tidal heating fluxes on Jupiter’s moon Io are shown as a gray shaded region (G. J. Veeder et al. 2012).
Other Images in This Article
Show More
Copyright and Terms & Conditions
© 2025. The Author(s). Published by the American Astronomical Society.
Copyright ©
2025 Astronomy Image Explorer. All Rights Reserved.