Image Details
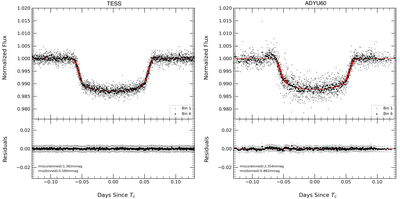
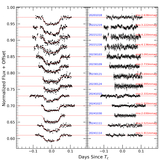
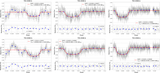
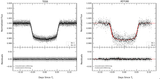
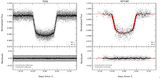
Caption: Figure 6.
Transit light curves of the exoplanet HAT-P-16b from two observational data sets. The left panel presents data from the TESS, and the right panel shows data from ADYU60. Each panel displays the normalized flux as a function of time, with unbinned data points shown as small black dots and binned data represented by a black line. The best-fit transit model is overlaid in red, highlighting the transit event. Below each flux plot, the residuals for the binned data are displayed with rms values of 0.58 mmag for TESS and 0.88 mmag for ADYU60.
Other Images in This Article
Show More
Copyright and Terms & Conditions
© 2025. The Author(s). Published by the American Astronomical Society.
Copyright ©
2025 Astronomy Image Explorer. All Rights Reserved.