Image Details
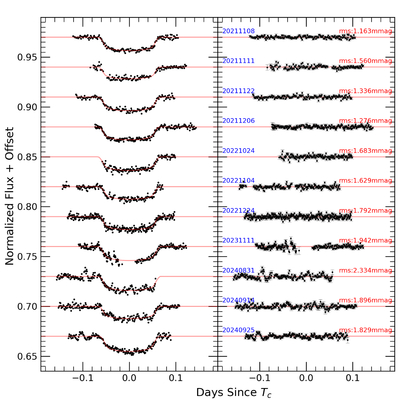
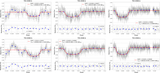
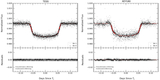
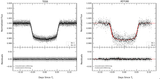
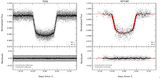
Caption: Figure 2.
The left panel shows 11 new transit light curves of HAT-P-16b observed with the ADYU60 telescope along with the transit model fits indicated as red lines. The y-scale is arbitrarily adjusted to provide visual clarity. The right panel displays the residuals along with the dates (in the format: yyyymmdd) and the rms calculated from residuals (in mmag) for each light curve.
Other Images in This Article
Show More
Copyright and Terms & Conditions
© 2025. The Author(s). Published by the American Astronomical Society.
Copyright ©
2025 Astronomy Image Explorer. All Rights Reserved.