Image Details
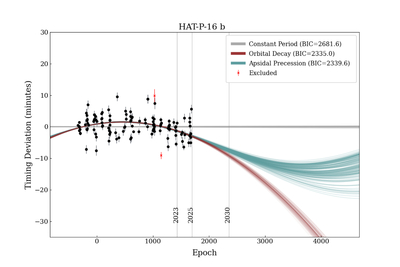
Caption: Figure 12.
Timing residuals of HAT-P-16 b with future projections of the three transit-timing models shown with 150 random draws from the MCMC posterior chains. Each data point is the difference between an observed time and the time predicted by the best-fit constant-period model. The size of the data points corresponds to the data quality index from 1 to 3, with the higher-quality transits being larger. The red crosses represent observations removed during the sigma-clipping process.
Other Images in This Article
Show More
Copyright and Terms & Conditions
© 2025. The Author(s). Published by the American Astronomical Society.
Copyright ©
2025 Astronomy Image Explorer. All Rights Reserved.