Image Details
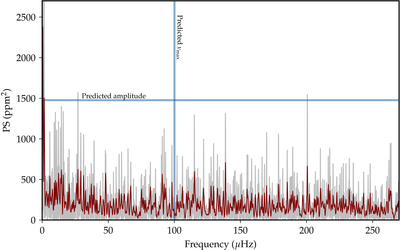
Caption: Figure 5.
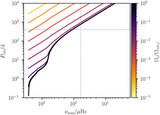
Power spectrum of BH3*. The red line is the power spectrum convolved with a Gaussian kernel of width 0.2 μHz, to highlight the absence of any significant signal. The blue vertical and horizontal lines correspond to the predicted power excess and power of the asteroseismic signal.
Other Images in This Article
Copyright and Terms & Conditions
© 2025. The Author(s). Published by the American Astronomical Society.
Copyright ©
2025 Astronomy Image Explorer. All Rights Reserved.