Image Details
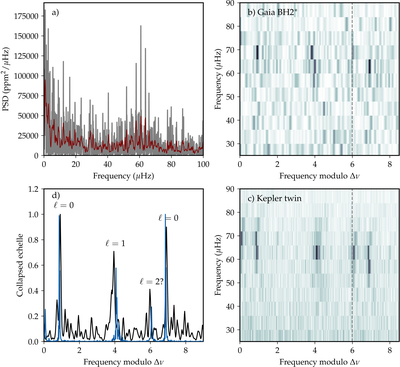
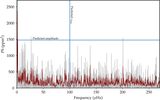
Caption: Figure 2.
(a) Power spectral density of BH2*, with the power excess around 60 μHz. The red line is the power spectrum convolved with a Gaussian kernel of width 0.2 μHz, highlighting the individual modes. (b) The echelle diagram of the PSD at the measured Δν (dashed line). (c) The echelle diagram for a Kepler twin (see the main text), with similar stellar properties. (d) The collapsed echelle diagram of BH2* (black) and the Kepler twin (blue), highlighting the radial, dipole, and quadrupole modes.
Other Images in This Article
Copyright and Terms & Conditions
© 2025. The Author(s). Published by the American Astronomical Society.
Copyright ©
2025 Astronomy Image Explorer. All Rights Reserved.