Image Details
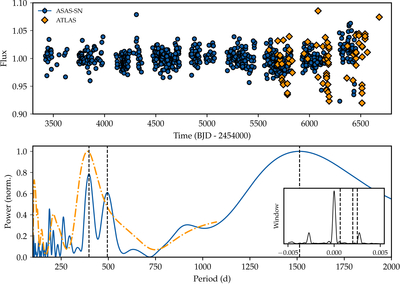
Caption: Figure 3.
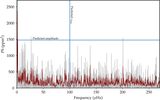
Top panel: ASAS-SN (blue circle) and ATLAS (orange diamond) light curves of BH2*. The ASAS-SN light curve is the combination of several different cameras in the network, each of which has its own offset, which has been median-divided out. Bottom panel: the power spectra of the ASAS-SN (blue) and ATLAS (orange) light curves. The dashed black lines indicate measured periods at 397, 495, and 1513 days. The inset on the bottom panel shows the window function (in frequency, day−1), with a signal at Earth’s orbital frequency (1/365) day−1. There are no peaks in the ASAS-SN window function associated with our measured periods (black dashed lines).
Other Images in This Article
Copyright and Terms & Conditions
© 2025. The Author(s). Published by the American Astronomical Society.