Image Details
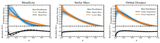
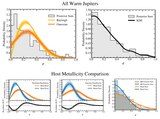
Caption: Figure 8.
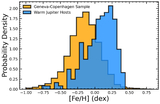
Top left: additional underlying Rayleigh and Gaussian HBM tests for the full sample of warm Jupiters. Solid lines represent a truncated Gaussian hyperprior, while dashed lines represent a log-uniform hyperprior. Thin lines in the background show randomly sampled distributions from the σR, μG, and σG hyperparameter posteriors. Top right: KDE test for the full sample of warm Jupiters in our analysis. Bottom: additional HBM tests for host star metallicity. We find that these additional tests are in good agreement with the differences between the underlying eccentricity distribution of warm Jupiters residing in metal-rich ([Fe/H] ≥ 0) and metal-poor ([Fe/H] < 0) systems seen in Figure 7.
Other Images in This Article
Copyright and Terms & Conditions
© 2025. The Author(s). Published by the American Astronomical Society.