Image Details
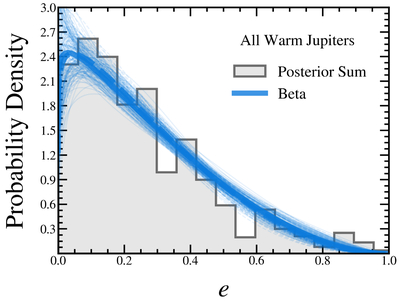
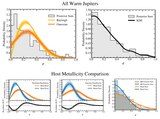
Caption: Figure 5.
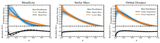
Underlying eccentricity distribution results from our HBM for all warm Jupiters. The blue curve displays the median inferred underlying e distributions modeled by the Beta distribution. Solid lines represent a truncated Gaussian hyperprior, while the dashed lines represent a log-uniform hyperprior. Thin lines in the background show randomly sampled distributions from the α and β hyperparameter posteriors. A summation of the eccentricity posteriors is plotted as a histogram in gray.
Other Images in This Article
Copyright and Terms & Conditions
© 2025. The Author(s). Published by the American Astronomical Society.
Copyright ©
2025 Astronomy Image Explorer. All Rights Reserved.