Image Details
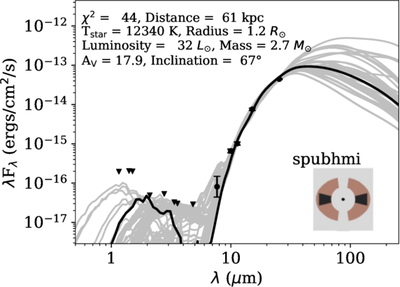
Caption: Figure 5.
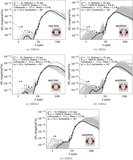
YSO fits for MZS-1a using the T. P. Robitaille (2017) model grid “spubhmi.” A cartoon representation of the YSO model configuration is shown in the inset. The observed MIRI fluxes are plotted as black circles, while the upper limits for the NIRCam filters (obtained using the background region) are indicated by downward triangles. The error bars on MIRI data-points represent the uncertainties in flux calculated from PSF fitting. The best-fit model is shown as the solid black line, and the corresponding output parameters are listed at the top left. Here the mass of the central star is derived using L = M3.5L⊙. The SED fitting for rest of the candidate protostellar cores are given in the Appendix.
Other Images in This Article
Copyright and Terms & Conditions
© 2025. The Author(s). Published by the American Astronomical Society.