Image Details
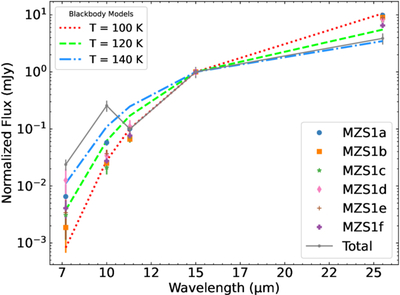
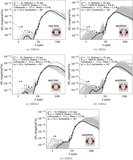
Caption: Figure 4.
SEDs generated for each core identified in Figure 3, derived using PSF photometry. Measured fluxes for each core are shown using distinct marker styles and colors, as indicated in the legend (bottom right). The gray line shows the total flux measured in a 8″ × 4″ elliptical aperture around MZS-1. All fluxes are normalized to flux in F1500W. While individual cores vary in brightness, their overall SED shapes are comparable. Overlaid are blackbody curves for three temperatures: 100 K (red), 120 K (green), and 140 K (blue). The error bars correspond to flux uncertainties derived from the PSF-fitting procedure.
Other Images in This Article
Copyright and Terms & Conditions
© 2025. The Author(s). Published by the American Astronomical Society.