Image Details
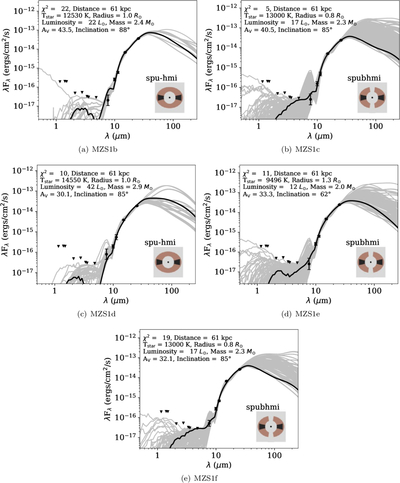
Caption: Figure A1.
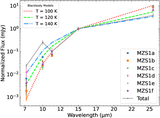
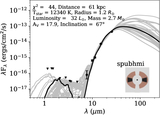
Same as Figure 5, but for the remaining candidate YSOs in MZS-1. Each panel shows SED fits using models from T. P. Robitaille (2017), based on the simplest and most likely model set as indicated in the insets. The black curve represents the best-fit model determined by χ2 minimization, with the corresponding parameters listed in the top-left corner. The gray curves show the other models within the same grid, which are used to estimate the parameter ranges reported in Table A1.
Other Images in This Article
Copyright and Terms & Conditions
© 2025. The Author(s). Published by the American Astronomical Society.
Copyright ©
2025 Astronomy Image Explorer. All Rights Reserved.