Image Details
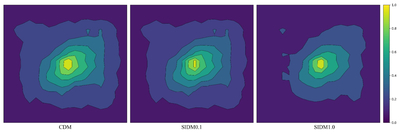
Caption: Figure 5.
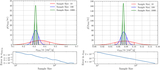
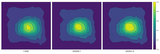
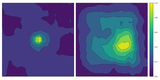
The feature contribution map for the classification of different dark matter models in the total channel approach. From left to right, the feature contribution maps obtained for the CDM, SIDM0.1, and SIDM1.0 models are shown. The color scale bar on the right indicates the normalized hi values corresponding to each point in the original distribution. Overlaid contours on each panel highlight the distribution pattern of hi. Notably, both the intensity regions and overall morphology exhibit significant variations with changes in the self-interaction strength.
Other Images in This Article
Copyright and Terms & Conditions
© 2025. The Author(s). Published by the American Astronomical Society.
Copyright ©
2025 Astronomy Image Explorer. All Rights Reserved.