Image Details
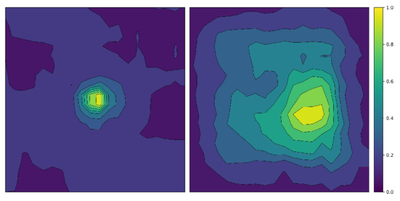
Caption: Figure 7.
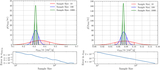
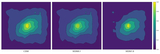
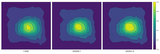
The left and right panels show the difference feature contribution maps for the total and X-ray channels, respectively. These maps are obtained by subtracting the feature contribution of SIDM0.1 from that of SIDM1.0. The color scale bar on the right indicates the normalized difference hi values. Overlaid contours on each panel highlight the spatial distribution of these differences. In the total channel, we can observe that regions that were previously sparse in contours have become denser, and a compact core has emerged. In the X-ray channel, it can be seen that the offset of the high-contribution core relative to the center is larger in the SIDM1.0 model compared to the SIDM0.1 model.
Other Images in This Article
Copyright and Terms & Conditions
© 2025. The Author(s). Published by the American Astronomical Society.