Image Details
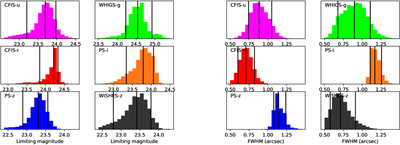
Caption: Figure 4.
Left panels: histograms of the 10σ point source depths of each UNIONS band measured through a 2″ aperture. Right panels: histograms of the image quality for each UNIONS band, measured as the FWHM of point sources. In all panels, the vertical lines show the median value and the 10th and 90th percentiles.
Other Images in This Article
Copyright and Terms & Conditions
© 2025. The Author(s). Published by the American Astronomical Society.
Copyright ©
2025 Astronomy Image Explorer. All Rights Reserved.