Image Details
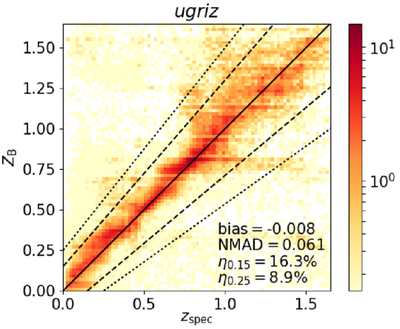
Caption: Figure 11.
Photometric redshifts estimated with BPZ from the GAaP catalog vs. spectroscopic redshifts. This logarithmically scaled density plot (arbitrarily normalized) shows the quality of ugriz photo-zs obtained from UNIONS multi-band photometry. The dashed and dotted lines indicate the limits for outliers, as defined in Section 4.
Other Images in This Article
Copyright and Terms & Conditions
© 2025. The Author(s). Published by the American Astronomical Society.
Copyright ©
2025 Astronomy Image Explorer. All Rights Reserved.