Image Details
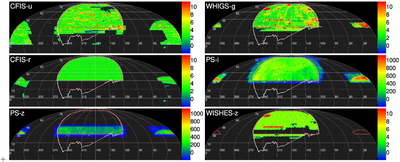
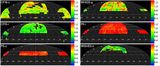
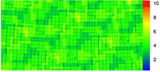
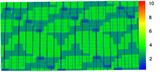
Caption: Figure 1.
Current spatial coverage of UNIONS for each of the five bands. The color scale indicates the number of images acquired (as of January 2025) in each location. Green (through red) indicates that the nominal depth has been achieved. The red lines show the nominal UNIONS footprint, both the current target footprint (down to δ = 30°, heavy line) and the proposed extension (down to δ = 15°, light line). The white line indicates the full northern Euclid Wide Survey footprint. The figure uses a Mollweide equal-area projection.
Other Images in This Article
Copyright and Terms & Conditions
© 2025. The Author(s). Published by the American Astronomical Society.
Copyright ©
2025 Astronomy Image Explorer. All Rights Reserved.