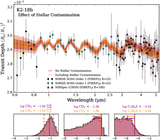
Image Details
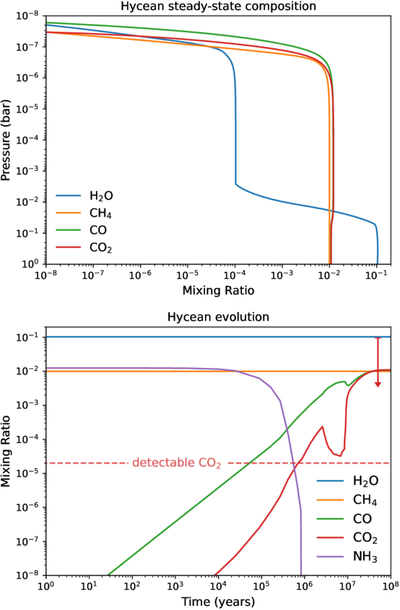
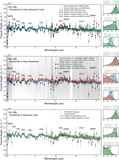
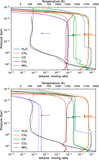
Caption: Figure 12.
Atmospheric composition over time for a hycean scenario for K2-18 b. Upper panel: the steady-state composition profiles computed by VULCAN in our hycean scenario. Lower panel: the composition evolution at 0.1 bar. The red arrow corresponds to the 2σ upper limit of CO2 from our retrievals, while the dashed line indicates the CO2 abundance required to produce a potentially detectable (∼100 ppm) transmission feature at 4.2 μm.
Other Images in This Article
Show More
Copyright and Terms & Conditions
© 2025. The Author(s). Published by the American Astronomical Society.
Copyright ©
2025 Astronomy Image Explorer. All Rights Reserved.