Image Details
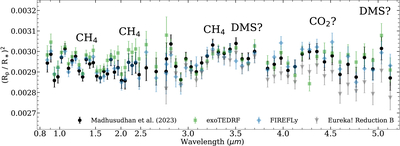
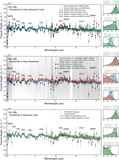
Caption: Figure 3.
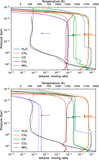
Comparison between our transmission spectra and the reduction from N. Madhusudhan et al. (2023). Three of our reductions, which were performed at the pixel-level and then binned to R ≈ 55, are shown: exoTEDRF (green squares), FIREFLy (blue diamonds), and the NIRSpec-only Eureka! reduction B (gray downward-pointing triangles). We show only Eureka! reduction B, since reduction A was performed at R = 100. We compare these binned pixel-level data to the low-resolution data from N. Madhusudhan et al. (2023), which were obtained using the JExoRES pipeline (black error bars; M. Holmberg & N. Madhusudhan 2023). The N. Madhusudhan et al. (2023) data were binned directly from their pixel-level data, so we bin our pixel-level data using the same binning approach. These R ≈ 55 data sets are purely for visual comparison with N. Madhusudhan et al. (2023), and are not used for retrievals later in our study. Wavelength locations of CH4, CO2, and DMS absorption features are annotated.
Other Images in This Article
Show More
Copyright and Terms & Conditions
© 2025. The Author(s). Published by the American Astronomical Society.