Image Details
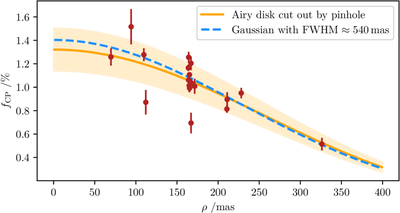
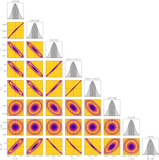
Caption: Figure 5.
Attenuated flux ratios fCP (red points) as measured directly from the interferometric closure phases, compared to the prediction assuming transmission loss by spatially filtering an Airy disk separated from the pinhole center by ρ (solid orange line). The nonattenuated flux ratio for ρ = 0 mas is computed from the mean of the flux ratios corrected from attenuation; the faint orange region covers their standard deviation. This treatment is consistent with a Gaussian description of the attenuation (dashed blue line).
Other Images in This Article
Copyright and Terms & Conditions
© 2025. The Author(s). Published by the American Astronomical Society.
Copyright ©
2026 Astronomy Image Explorer. All Rights Reserved.