Image Details
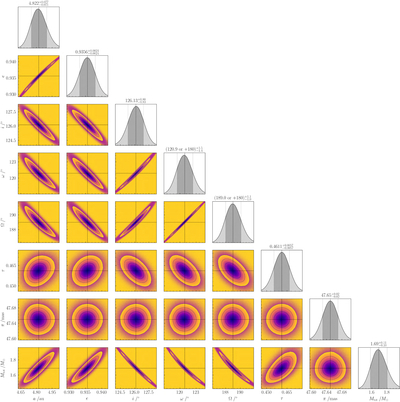
Caption: Figure 4.
Corner plot showing the converged orbitize! posterior sample thinned by a factor of 10 (i.e., 107 samples). We show gray 200-bin histograms for each orbital element along the diagonal with a KDE overplotted in black. Dashed and dotted lines mark the median and 0.16/0.84 quantiles computed from the complete posterior sample. The solid contours in the off-diagonal panels show the 2σ, 1.5σ, and 1σ equivalent levels estimated from two-dimensional KDEs, containing ≈86.5%, ≈67.5%, and ≈39.3% of the samples, with σ being the standard deviation of a circular bivariate Gaussian. Samples are scattered below the 2σ equivalent levels, and the two-dimensional KDEs are shown with filled contours above this level.
Other Images in This Article
Copyright and Terms & Conditions
© 2025. The Author(s). Published by the American Astronomical Society.