Image Details
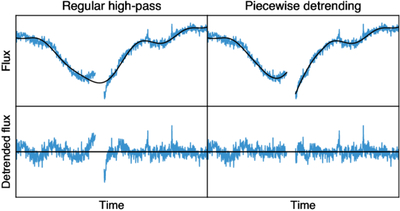
Caption: Figure 6.
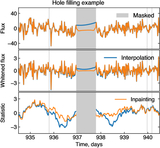
Illustration of regular high-pass filtering compared to the piecewise detrending method shown for one of the Kepler targets (KIC003852808). Top left: Kepler flux (blue line) and its low-frequency Fourier component (black line). Bottom left: the flux, after subtracting the low-frequency trend, has a spurious drop, which may produce a false positive. Top right: Kepler flux (blue line) and its trend obtained using the piecewise detrending module. Bottom right: with the piecewise detrending, the break is mitigated.
Other Images in This Article
Show More
Copyright and Terms & Conditions
© 2025. The Author(s). Published by the American Astronomical Society.
Copyright ©
2025 Astronomy Image Explorer. All Rights Reserved.